12128-7009 GAA 13 Aa,Ab (S Mus)
12h 12m 47.01s -70° 09' 06.4" P.A. 168.00 sep 0.0 mag 4.90,4.90 Sp F6Ib+B6V dist. 502.51 pc (1639.19 l.y.)
| Coord 2000 |
12128-7009 |
|
Discov num |
GAA 13 |
|
Comp |
Aa,Ab |
|
Coord arcsec 2000 |
12 12 47.01 -70 09 06.4 |
|
| Date first |
2015 |
|
Date last |
2017 |
|
Obs |
3 |
|
| Pa first |
344 |
|
Pa last |
168.2 |
|
P.A. Now (θ) |
168.2° |
|
| Sep first |
0.0 |
|
Sep last |
0.003 |
|
Sep. Now (ρ) |
0.003" |
|
| Mag pri |
4.90 |
|
Mag sec |
4.90 |
|
delta mag (ΔM) |
0 |
|
Spectral class |
F6Ib+B6V (yellow-white/blue-white) |
|
| Pri motion ra |
-008 |
|
Sec motion ra |
|
|
| Pri motion dec |
-002 |
|
Sec motion dec |
|
|
| Notes |
N
O
K
(See Notes, Orbital solution, K-band or other infrared magnitudes) |
|
Visually invisible, K-band or other infrared star : Summary line gives K-band or other infrared (>1 micron) magnitudes
This double is physical.
12128-7009 SYSTEM COMPONENTS
| Show |
name |
SAO |
coord |
wds_name |
last |
obs |
pa |
sep |
mag1 |
mag2 |
d_mag |
orb |
current |
| Show |
S Mus |
251791 |
12 12 47 -70 09 06 |
GAA 13 Aa,Ab |
2017 |
3 |
168 |
0.0 |
4.90 |
4.90 |
0.00 |
Y |
<=== |
| Show |
|
251791 |
12 12 47 -70 09 06 |
EVS 17 AB |
2011 |
1 |
183 |
5.0 |
6.20 |
17.94 |
11.74 |
|
|
Triple system
2 estimated visually detectable stars in this system
OTHER CATALOGS AND DESIGNATIONS
| Var name |
S Mus |
|
Constellation |
Musca |
|
SAO |
251791 |
|
HIP |
59551 |
|
| Tycho2 |
9231-00752-1 |
|
HD |
106111 |
|
HR |
4645 |
|
GC |
16679 |
|
| CD |
CD-69 977 |
|
CP |
CP-69 1646 |
|
Distance |
502.51 |
|
Distance ly |
1639.19 |
|
ORBITAL ELEMENTS
| Period (P) | 506.3d | ± 0.5 |
Periastron (T) | 57165.9d (2015.391y) | ± 4.4 |
Semi-major axis (a) | 2.95m | ± 0.09 |
| Eccentricity (e) | 0.088 | ± 0.006 |
Inclination (i) | 144.7° | ± 2.8 |
Longitude of periastron (ω) | 194.8° | ± 3.3 |
| Node (Ω) | 99.6° | ± 14.4 |
Notes | n | |
Reference | GaA2019b | |
| Equinox | | |
Last observation | 2017 | |
Grade | 5 | (1=Definitive, 9=Indet.) |
| label |
theta |
rho |
| 2000-01-01 |
303.9 |
0.003 |
| 2001-01-01 |
54.3 |
0.003 |
| 2002-01-01 |
129.2 |
0.003 |
| 2003-01-01 |
244.2 |
0.003 |
| 2004-01-01 |
349.7 |
0.002 |
| 2005-01-01 |
86.4 |
0.003 |
| 2006-01-01 |
170.2 |
0.002 |
| 2007-01-01 |
286.2 |
0.003 |
| 2008-01-01 |
37.0 |
0.003 |
| 2009-01-01 |
115.3 |
0.003 |
| 2010-01-01 |
222.9 |
0.002 |
| 2011-01-01 |
328.7 |
0.003 |
| 2012-01-01 |
73.4 |
0.003 |
| 2013-01-01 |
150.5 |
0.003 |
| 2014-01-01 |
268.7 |
0.003 |
| 2015-01-01 |
17.4 |
0.002 |
| 2016-01-01 |
102.6 |
0.003 |
| 2017-01-01 |
199.7 |
0.002 |
| 2018-01-01 |
309.4 |
0.003 |
| 2019-01-01 |
58.9 |
0.003 |
| 2020-01-01 |
133.7 |
0.003 |
| 2021-01-01 |
250.1 |
0.003 |
| 2022-01-01 |
356.1 |
0.002 |
| 2023-01-01 |
90.2 |
0.003 |
| 2024-01-01 |
176.7 |
0.002 |
| 2025-01-01 |
291.4 |
0.003 |
| 2026-01-01 |
42.4 |
0.003 |
| 2027-01-01 |
119.3 |
0.003 |
| 2028-01-01 |
229.5 |
0.002 |
| 2029-01-01 |
334.9 |
0.002 |
| 2030-01-01 |
77.4 |
0.003 |
|
|
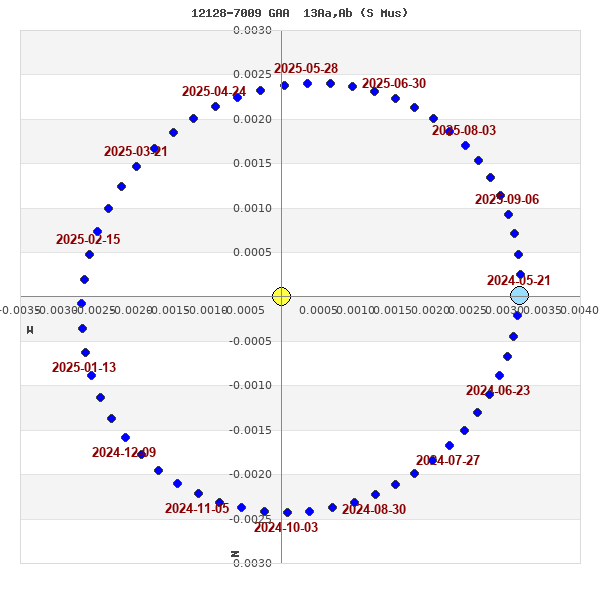
Note: Theta is PA, Rho is Sep. For yearly orbits, data refer to Jan 1st.
|
|
|
|
|
|
|
|
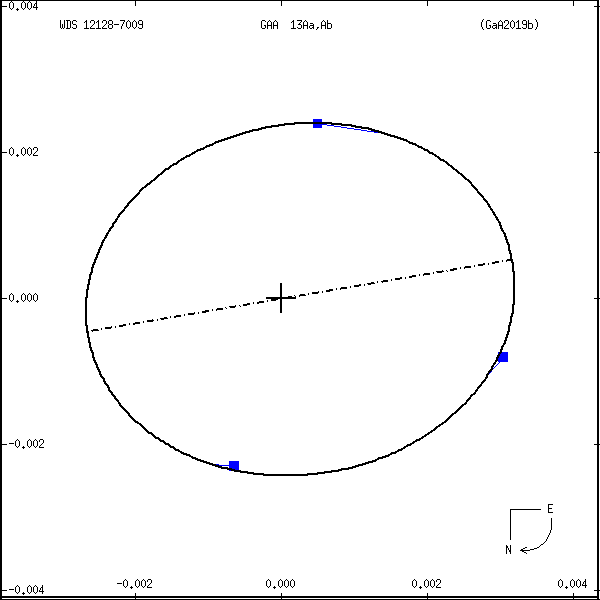
Measures: green=micrometric, blue=interferometric, purple=photographic |
|