18465-0058 MCA 53 Aa,Ab
18h 46m 28.58s -00° 57' 41.9" P.A. 95.00 sep 0.0 mag 5.88,6.80 Sp A2V dist. 111.86 pc (364.89 l.y.)
| Coord 2000 | 18465-0058 | Discov num | MCA 53 | Comp | Aa,Ab | Coord arcsec 2000 | 18 46 28.58 -00 57 41.9 | ||||
| Date first | 1980 | Date last | 2014 | Obs | 8 | ||||||
| Pa first | 8 | Pa last | 95.3 | P.A. Now (θ) | 95.3° | ||||||
| Sep first | 0.1 | Sep last | 0.027 | Sep. Now (ρ) | 0.027" | ||||||
| Mag pri | 5.88 | Mag sec | 6.80 | delta mag (ΔM) | 0.92 | Spectral class | A2V (white) | ||||
| Pri motion ra | +023 | Sec motion ra | |||||||||
| Pri motion dec | -023 | Sec motion dec | |||||||||
| Notes | N O (See Notes, Orbital solution) | ||||||||||
18465-0058 SYSTEM COMPONENTS
| Show | name | SAO | coord | wds_name | last | obs | pa | sep | mag1 | mag2 | d_mag | orb | current |
| Show | 142606 | 18 46 29 -00 57 42 | MCA 53 Aa,Ab | 2014 | 8 | 95 | 0.0 | 5.88 | 6.80 | 0.92 | Y | <=== | |
| Show | 5 Aql | 142606 | 18 46 29 -00 57 42 | STF 2379 AB | 2019 | 118 | 121 | 12.5 | 5.88 | 7.02 | 1.14 | ||
| Show | 142606 | 18 46 29 -00 57 42 | STF 2379 AC | 2017 | 16 | 155 | 21.8 | 5.88 | 11.30 | 5.42 | |||
| Show | 18 46 29 -00 57 48 | STF 2379 BC | 2017 | 14 | 172 | 13.4 | 7.02 | 11.30 | 4.28 |
3 estimated visually detectable stars in this system
OTHER CATALOGS AND DESIGNATIONS
| Constellation | Aquila | SAO | 142606 | HIP | 92117 | Tycho2 | 5114-02267-1 | ||||
| HD | 173654 | HR | 7059 | GC | 25713 | ADS | 11667 | ||||
| BD | BD-01 3559 | Flamsteed | 5 Aquilae | Flamsteed name | 5 Aql | Distance | 111.86 | ||||
| Distance ly | 364.89 |
ORBITAL ELEMENTS
| Period (P) | 41.28y | Periastron (T) | 2012.5y | Semi-major axis (a) | 0.103a | |||
| Eccentricity (e) | 0.666 | Inclination (i) | 127.3° | Longitude of periastron (ω) | 358° | |||
| Node (Ω) | 164.8° | Notes | n | Reference | Doc2017f | |||
| Equinox | 2000 | Last observation | 2014 | Grade | 4 | (1=Definitive, 9=Indet.) |
|
|
Note: Theta is PA, Rho is Sep. For yearly orbits, data refer to Jan 1st. |
|
||||||||||||||||||||||||||||||||||||||||||||||||||||||||||||||||||||||||||||||||||||||||||||||||
|
|
|
|
|
||||||||||||||||||||||||||||||||||||||||||||||||||||||||||||||||||||||||||||||||||||||||||||||||
|
|
|
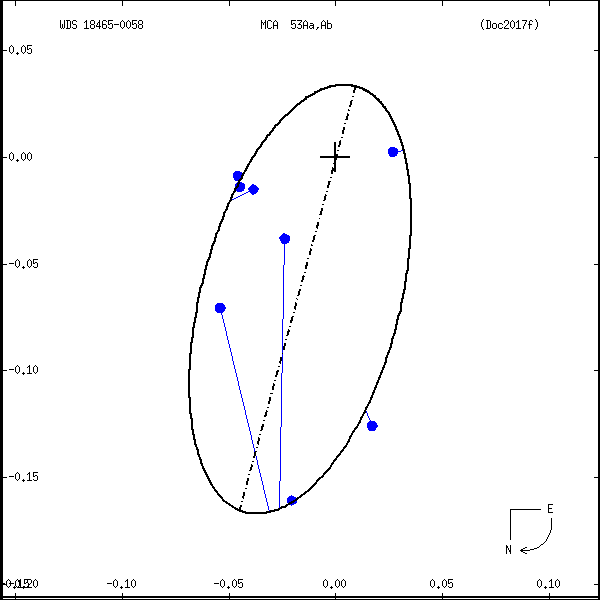 Measures: green=micrometric, blue=interferometric, purple=photographic |
|