23374+0737 FOX 102 AB
23h 37m 23.17s +07° 37' 26.2" P.A. 115.00 sep 0.2 mag 9.12,9.23 Sp F5 dist. 130.72 pc (426.41 l.y.)
| Coord 2000 |
23374+0737 |
|
Discov num |
FOX 102 |
|
Comp |
AB |
|
Coord arcsec 2000 |
23 37 23.17 +07 37 26.2 |
|
| Date first |
1920 |
|
Date last |
2021 |
|
Obs |
60 |
|
| Pa first |
171 |
|
Pa last |
115.4 |
|
P.A. Now (θ) |
116.7° |
|
| Sep first |
0.4 |
|
Sep last |
0.208 |
|
Sep. Now (ρ) |
0.223" |
|
| Mag pri |
9.12 |
|
Mag sec |
9.23 |
|
delta mag (ΔM) |
0.11 |
|
Spectral class |
F5 (yellow-white) |
|
| Pri motion ra |
-018 |
|
Sec motion ra |
|
|
| Pri motion dec |
+005 |
|
Sec motion dec |
|
|
| Notes |
O
(Orbital solution) |
|
This double is physical.
23374+0737 SYSTEM COMPONENTS
| Show |
name |
SAO |
coord |
wds_name |
last |
obs |
pa |
sep |
mag1 |
mag2 |
d_mag |
orb |
current |
| Show |
|
128291 |
23 37 23 +07 37 26 |
FOX 102 AB |
2021 |
60 |
115 |
0.2 |
9.12 |
9.23 |
0.11 |
Y |
<=== |
| Show |
|
128291 |
23 37 23 +07 37 26 |
FOX 102 AB,C |
2014 |
6 |
276 |
42.1 |
7.62 |
12.98 |
5.36 |
|
|
Triple system
4 estimated visually detectable stars in this system
OTHER CATALOGS AND DESIGNATIONS
| Constellation |
Pisces |
|
SAO |
128291 |
|
HIP |
116571 |
|
Tycho2 |
1169-00533-1 |
|
| Gaia DR2 |
2757923299626980224 |
|
HD |
222068 |
|
ADS |
16873 |
|
BD |
BD+06 5178 |
|
| Distance |
130.72 |
|
Distance ly |
426.41 |
|
ORBITAL ELEMENTS
| Period (P) | 127.12y | ± 3.2 |
Periastron (T) | 2006.75y | ± 0.64 |
Semi-major axis (a) | 0.263a | ± 0.005 |
| Eccentricity (e) | 0.292 | ± 0.01 |
Inclination (i) | 22.2° | ± 2.8 |
Longitude of periastron (ω) | 259.4° | ± 7.8 |
| Node (Ω) | 139.1° | ± 6.6 |
Notes | | |
Reference | Tok2015c | |
| Equinox | 2000 | |
Last observation | 2014 | |
Grade | 3 | (1=Definitive, 9=Indet.) |
| label |
theta |
rho |
| 2000 |
0.9 |
0.188 |
| 2001 |
5.9 |
0.184 |
| 2002 |
11.1 |
0.181 |
| 2003 |
16.5 |
0.179 |
| 2004 |
22.0 |
0.176 |
| 2005 |
27.6 |
0.175 |
| 2006 |
33.3 |
0.173 |
| 2007 |
39.1 |
0.173 |
| 2008 |
44.9 |
0.173 |
| 2009 |
50.7 |
0.173 |
| 2010 |
56.5 |
0.174 |
| 2011 |
62.1 |
0.176 |
| 2012 |
67.7 |
0.178 |
| 2013 |
73.0 |
0.181 |
| 2014 |
78.2 |
0.184 |
| 2015 |
83.3 |
0.188 |
| 2016 |
88.1 |
0.191 |
| 2017 |
92.7 |
0.196 |
| 2018 |
97.2 |
0.200 |
| 2019 |
101.4 |
0.204 |
| 2020 |
105.5 |
0.209 |
| 2021 |
109.4 |
0.213 |
| 2022 |
113.1 |
0.218 |
| 2023 |
116.7 |
0.223 |
| 2024 |
120.1 |
0.227 |
| 2025 |
123.4 |
0.232 |
| 2026 |
126.6 |
0.236 |
| 2027 |
129.6 |
0.240 |
| 2028 |
132.6 |
0.245 |
| 2029 |
135.4 |
0.249 |
| 2030 |
138.2 |
0.253 |
|
|
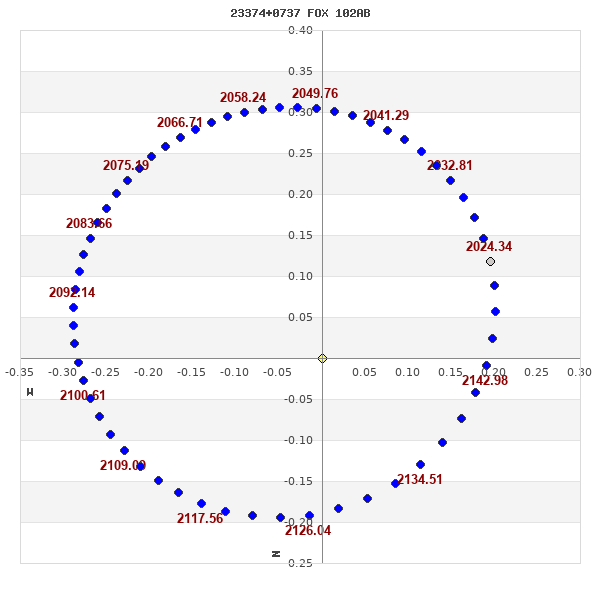
Note: Theta is PA, Rho is Sep. For yearly orbits, data refer to Jan 1st.
|
|
|
|
|
|
|
|
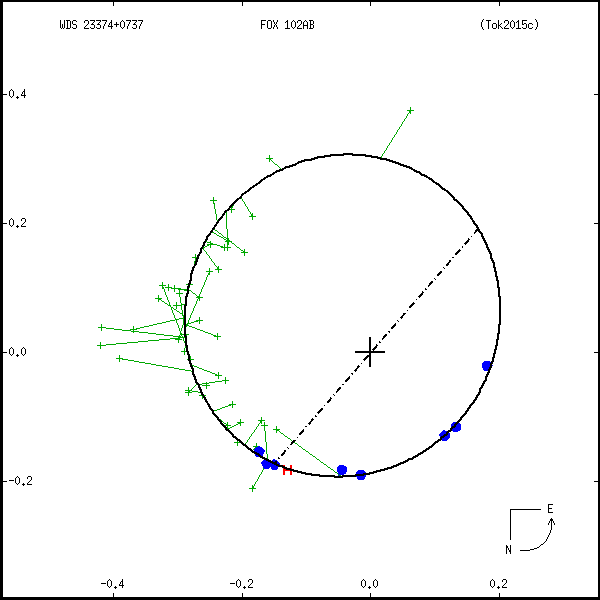
Measures: green=micrometric, blue=interferometric, purple=photographic |
|